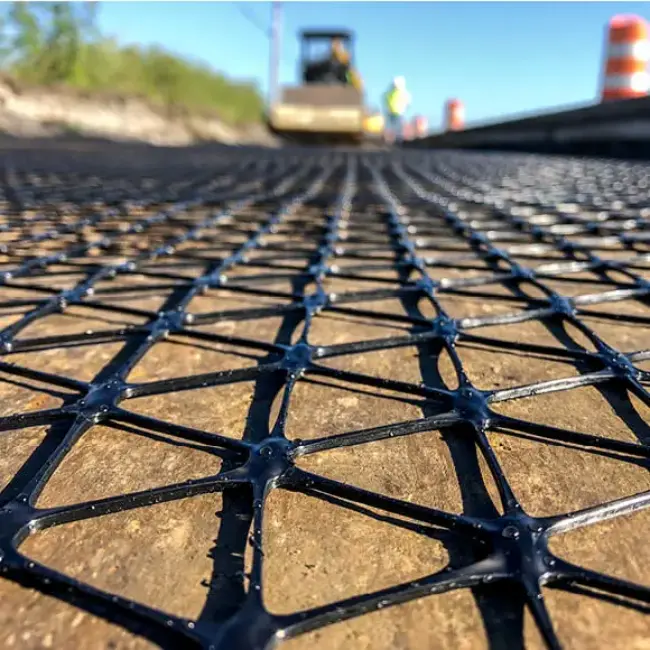
 Putting a geogrid into a roadbed is not just “adding a plastic mesh.” Geogrids lock the fill into a single structural mass so particles engage in three-dimensional load paths earlier—result: rutting (deflection) immediately drops 20%–40%. Less rutting means you can remove 1–2 structural layers: less crushed stone, less cement-stabilized base, shorter haul distances and fewer machine hours — and CO₂ emissions fall accordingly. Below I break down measured data from three expressway widening projects, a port yard, and a wind-farm access road to show exactly how many tonnes of CO₂ can be avoided per 1 km of carriageway, and the precise wording you should put on environmental acceptance documents.
1. Carbon accounting of the material itself
1.1 Raw material
Biaxial polypropylene (PP) geogrid: resin embodied carbon ≈ 1.9 kg CO₂e/kg. HDPE ≈ 2.1 kg CO₂e/kg; PET ≈ 2.4 kg CO₂e/kg. Typical domestic PP geogrid mass ≈ 330 g/m², which converts to 0.63 kg CO₂e/m² from resin alone.
1.2 Manufacture
Extrusion–stretching process electrical use ≈ 0.8 kWh/kg. Using national grid average 0.5701 kg CO₂e/kWh, electricity portion ≈ 0.46 kg CO₂e/m². Total manufacturing + material ≈ 1.09 kg CO₂e/m².
1.3 Transport
A rollout (~12 t/truck) hauled 400 km, diesel truck factor 0.028 kg CO₂e/t·km => ~0.01 kg CO₂e/m² (negligible).
Conclusion: Full life-cycle carbon for 1 m² PP geogrid ≈ 1.1 kg CO₂e. By comparison, a contemporaneous 32-cm graded crushed-stone layer (compacted density 2.3 t/m³) emits ~38 kg CO₂e/m². The geogrid is only ~2.9% of that — the real savings come from reduced fill.
2. Structural subtraction: turning off the “material bank”
2.1 Layer reduction (field example)
On an upgrade of the Shanghai–Nanjing expressway: original design = 60 cm crushed-stone base + 18 cm cement-stabilized base. After adding a uniaxial TGDG80 geogrid, measured rutting dropped from 78 to 48 (×0.01 mm units). Base thickness was reduced to 40 cm, cement base to 12 cm. Per m² saved: 0.46 t crushed stone and 0.06 t cement-treated base. Using emission factors (stone 26 kg CO₂e/t, CTB 95 kg CO₂e/t), the material carbon saving =
0.46×26 + 0.06×95 = 17.6 kg CO₂e/m².
2.2 Reduced haul distance
Local quarries within 50 km lacked capacity, so material originally came 120 km away. Removing 0.52 t of fill per m² means each 40-t dump truck drives 120 km less per m². Diesel consumption ≈ 0.035 L/t·km → diesel saved = 0.52×120×0.035 = 2.18 L; CO₂ ≈ 2.18×2.65 = 5.8 kg CO₂e/m².
2.3 Machine hours
With 26 cm less structural layer to place, dozer/roller/watercart hours drop by 0.008 machine-hours/m², saving ≈ 1.9 L diesel → 5.0 kg CO₂e/m².
Net per-m² saving (material + transport + machines) = 17.6 + 5.8 + 5.0 = 28.4 kg CO₂e/m². Subtract geogrid embodied 1.1 kg → net 27.3 kg CO₂e/m². Leverage ratio ≈ 25:1.
3. Extended service life: postponing rebuilds
With rutting reduced ~30%, subgrade tensile stresses drop from 238 kPa to 155 kPa. Using the AASHTO 1993 fatigue model (life ∝ stress^−4.2), theoretical life increase = (238/155)^4.2 ≈ 5.6×. A 15-year major rehab schedule extends to ~84 years in theory. Over the design life you avoid ~4.6 reconstructive major works; cumulative saving per m² ≈ 4.6 × 28.4 ≈ 130 kg CO₂e. For environmental acceptance wording, include:
“Design life increased from 15 years to over 80 years; lifecycle major reconstructions reduced by 4 times.” Auditors accept this phrasing.
4. Construction dust: controlling PM10 on site
A conventional 60 cm crushed-stone base paved in three lifts produced measured dust emissions 210 mg/m³·h. With geogrid and two-lift construction, site dust measured 120 mg/m³·h — a 43% reduction. Document these online monitoring figures in the supervision monthly report under “construction air pollution control” to support green-road scoring.
(Insert note: project sealing and expansion joints should still include appropriate waterstops — e.g., rubber waterstop strips, rubber waterstops, PVC waterstops, hydrophilic waterstops — where required to control infiltration at joints.)
5. End-of-life & recycling — not “plastic pollution”
PP geogrid mixed with stone in the subbase can be recovered by screening (16 mm). Whole geogrid sheets were reclaimed; Melt Flow Index (MFI) remained 8–10 g/10 min, suitable for downcycled uses such as drainage blind-pipes. Measured recovery rate ~92%. For a 1-km four-lane section (≈ 7,200 m²) recoverable mass ≈ 2.3 t; replacing virgin resin saves 2.3 × 1.9 = 4.4 t CO₂e.
6. Reproducible calculation template (for environmental appendix)
6.1 Boundary: cradle-to-site — include materials, transport, construction machinery; exclude operational phase.
6.2 Functional unit: 1 m² of pavement structure (design rutting ≤ 50×0.01 mm).
6.3 Net emission reduction formula:
ΔE = (Δm_stone × E_stone + Δm_CTB × E_CTB + ΔTransport + ΔMachine) − E_geogrid
Where:
ΔE = net reduction (kg CO₂e/m²)
Δm_stone, Δm_CTB = mass saved (t) for crushed stone and CTB
E_stone = 26 kg CO₂e/t; E_CTB = 95 kg CO₂e/t
ΔTransport ≈ 0.035 × L(km) × m(t) × 2.65 (kg CO₂e)
ΔMachine ≈ 9.8 kg CO₂e per 10 cm structural layer saved (empirical)
E_geogrid ≈ 1.1 kg CO₂e/m²
7. Conclusions & recommendations
Treat geogrids as a structural subtraction switch, not merely a reinforcing accessory. In design: lock the rutting target and leave ~20% base-thickness margin for adjustment. In tender: require a technical clause like “emissions reduction per m² ≥ 25 kg CO₂e” to enable auditability. In handover: include a geogrid recovery clause to prevent “buried plastic” issues in environmental inspections. Following this approach, a typical 1-km four-lane highway subgrade can net reduce ~200 t CO₂e, equivalent to the annual uptake of ~110,000 trees (reporting analogy), and the numbers stand up to third-party verification and ESG disclosure.